What is Fundamental Analysis? A Guide to Long-Term Investing
Blog Details When it comes to building wealth in the stock market, successful investors don’t rely on luck. They rely on research, analysis, and strategy — and at the heart of that strategy lies fundamental analysis. Whether you’re a beginner planning your first investment or someone looking to refine your skills, understanding fundamental analysis can be your game-changer. In this blog, we’ll break down what it is, how it works, and how you can use it to make long-term, smart investment decisions. 📌 What is Fundamental Analysis? Fundamental analysis is the process of evaluating a company’s financial health, performance, industry position, and economic environment to determine the true value of its stock. It answers the big question:“Is this stock worth buying at its current price?” The goal is to find undervalued stocks — companies that are worth more than what the market currently believes — and hold them until their true value is recognized. 🧩 Key Elements of Fundamental Analysis To perform a complete fundamental analysis, investors typically examine: 1. Financial Statements These are the most important tools in understanding how a company is performing. Balance Sheet – Shows assets, liabilities, and shareholder equity Income Statement – Reveals profit/loss over a period (also called Profit & Loss statement) Cash Flow Statement – Shows how cash is flowing in and out of the business Look for things like: Revenue growth Net profit margin Debt-to-equity ratio Free cash flow 2. Key Financial Ratios Ratios help you compare companies and spot red flags: P/E Ratio (Price to Earnings): High P/E may mean overvalued stock EPS (Earnings Per Share): Measures company’s profit per share ROE (Return on Equity): Profitability vs shareholder investment Current Ratio: Company’s ability to pay short-term obligations 3. Company’s Management & Business Model A good product isn’t enough. A company’s leadership and vision matter too. Ask: Is the management experienced? Is the business model sustainable and scalable? Does the company have a unique advantage (a “moat”)? 4. Industry and Competitor Analysis Understand how the company is positioned within its industry. Is it a market leader? What are its biggest risks? Who are its competitors? 5. Macroeconomic Factors Even the strongest companies are affected by the broader economy. Inflation Interest rates Government policies Global events These affect investor sentiment and long-term growth potential. 📈 How Does It Help in Long-Term Investing? Unlike short-term trading (which focuses on price patterns and indicators), fundamental analysis focuses on business value. Long-term investors use it to: Buy low and hold for years Ignore short-term volatility Focus on consistent growth and compounding returns Build wealth patiently 🔑 Example:Warren Buffett famously uses fundamental analysis to find undervalued companies and hold them for decades. ✅ Benefits of Fundamental Analysis Builds conviction in your investments Reduces emotional decision-making Helps avoid bad companies with poor financials Supports wealth creation through long-term investing 🚫 Limitations Time-consuming Doesn’t account for short-term price movement Predictions are still estimates, not guarantees But when used correctly, it’s one of the most powerful tools for long-term success.
Common Mistakes New Traders Make (And How to Avoid Them)
Blog Details Starting your trading journey is exciting, but it’s also filled with risks — especially if you’re unaware of the common mistakes that most beginners make. Avoiding these early errors can save you time, money, and a lot of stress. In this blog, we’ll walk through the top trading mistakes new traders make — and more importantly, how you can avoid them to stay on the path to profitability. ❌ Mistake #1: Trading Without a Plan What Happens:Many beginners jump into the market based on tips, news, or emotion, without a proper trading strategy or risk management in place. Why It’s Dangerous:Without a clear plan, you end up making impulsive decisions — which leads to inconsistent results. ✅ How to Avoid It: Create a written trading plan with entry/exit rules, risk per trade, and strategy Stick to your plan and revise only after backtesting ❌ Mistake #2: Risking Too Much on a Single Trade What Happens:You feel confident and put a big chunk of your capital into one trade. Why It’s Dangerous:One bad trade can wipe out your account or shake your confidence badly. ✅ How to Avoid It: Follow the 1–2% rule: Never risk more than 2% of your capital on one trade Use stop-loss orders every time ❌ Mistake #3: Overtrading What Happens:You feel the urge to trade every movement in the market. Why It’s Dangerous:Overtrading leads to poor decision-making, losses, and burnout. ✅ How to Avoid It: Stick to quality setups Set a maximum number of trades per day or week Trade only when your edge is present ❌ Mistake #4: Letting Emotions Rule What Happens:Fear, greed, and impatience take over during live trading. Why It’s Dangerous:Emotional trading leads to revenge trades, early exits, or holding losers too long. ✅ How to Avoid It: Always use a trading journal to track your emotions Follow pre-defined rules, not feelings Take breaks when you feel overwhelmed 📖 Also read: [The Psychology of Trading: How to Control Fear, Greed & Impatience] ❌ Mistake #5: Ignoring Risk Management What Happens:You focus only on profits and neglect how much you could lose. Why It’s Dangerous:Even the best strategies fail without proper risk control. ✅ How to Avoid It: Always set a stop-loss and target Calculate risk-reward ratio (preferably 1:2 or higher) Use position sizing based on your capital ❌ Mistake #6: Chasing the Market What Happens:You see a stock rallying and jump in too late out of FOMO (Fear of Missing Out). Why It’s Dangerous:You enter at poor prices and the trend often reverses just after your entry. ✅ How to Avoid It: Wait for proper pullbacks or retests Stick to your setup criteria Don’t follow hype — follow charts ❌ Mistake #7: Not Reviewing Past Trades What Happens:You keep making the same mistakes without realizing them. Why It’s Dangerous:No improvement = repeated losses ✅ How to Avoid It: Maintain a trading journal with screenshots and notes Analyze winners and losers weekly Adjust your strategy based on data
Top 5 Technical Indicators Every Trader Should Know
Blog Details If you’re serious about trading, relying only on instincts or news isn’t enough. Successful traders combine strategy with tools that help them analyze the market. These tools are called technical indicators — and they are essential for making smart, data-backed decisions. In this blog, we’ll explore the top 5 technical indicators that every trader — especially beginners — should understand and use. 🔍 1. Moving Averages (MA) Best For: Identifying trends A moving average smooths out price data to identify the direction of a trend over time. It’s a simple line, but very powerful when used right. Types: SMA (Simple Moving Average): Average price over a specific time. EMA (Exponential Moving Average): Gives more weight to recent prices. Use Case: If the price is above the MA line, it’s considered an uptrend. If below, it’s a downtrend. ✅ Pro Tip: Use the 50-day and 200-day EMAs for long-term trading and crossovers. 📈 2. Relative Strength Index (RSI) Best For: Spotting overbought or oversold conditions The RSI is a momentum indicator that tells you whether a stock is being overbought or oversold. Scale: 0–100 Above 70: Overbought (possible sell signal) Below 30: Oversold (possible buy signal) Use Case:If RSI is near 30 and the stock is near support, it could be a buying opportunity. ✅ Pro Tip: Combine RSI with support/resistance levels for stronger signals. 📉 3. MACD (Moving Average Convergence Divergence) Best For: Spotting trend reversals MACD is a trend-following momentum indicator that shows the relationship between two EMAs. Includes the MACD line, Signal line, and a Histogram Use Case: When the MACD line crosses above the signal line — it’s a bullish signal When it crosses below — it’s a bearish signal ✅ Pro Tip: Use MACD with volume analysis for confirmation. 📊 4. Bollinger Bands Best For: Volatility and breakout trading Bollinger Bands consist of three lines: A middle SMA An upper band A lower band The bands expand and contract with market volatility. Use Case: Price touching the upper band = Overbought Price touching the lower band = Oversold ✅ Pro Tip: Look for a “squeeze” (bands narrowing), which often signals a big move is coming. 📌 5. Volume Best For: Validating trends and breakouts Volume is often overlooked, but it’s extremely important. It shows how many shares/contracts were traded in a given time. Use Case: A breakout with high volume = Stronger and reliable A breakout with low volume = Possibly fake or weak ✅ Pro Tip: Combine volume with candlestick patterns to confirm reversals or continuation.
The Psychology of Trading: How to Control Fear, Greed, and Impatience
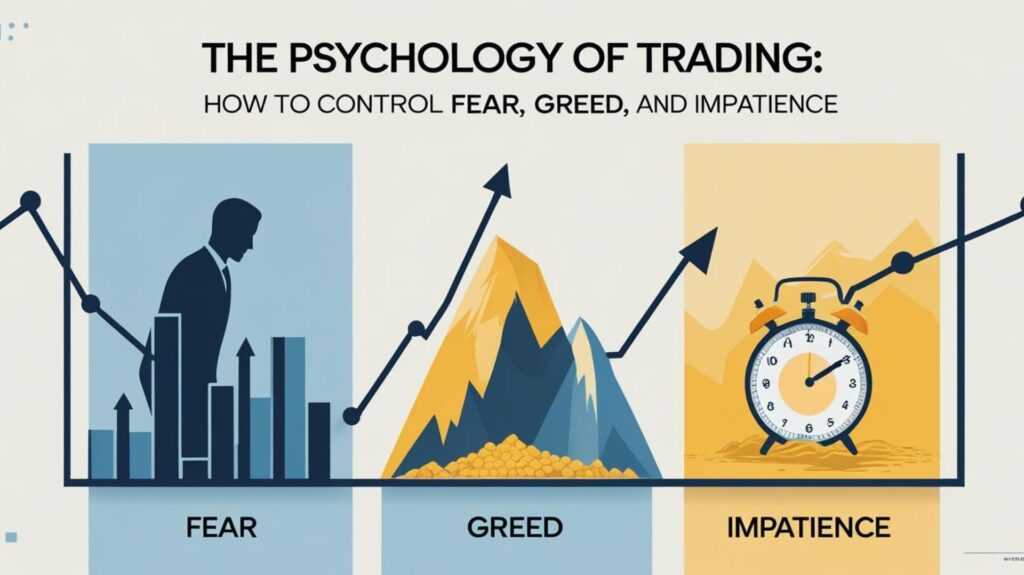
Blog Details Trading isn’t just about technical analysis, charts, or market news — it’s equally about controlling your mindset. In fact, mastering trading psychology can be the difference between consistent profits and costly mistakes. If you’ve ever exited too early, held on too long, or entered impulsively — you’re not alone. These behaviors are emotionally driven. This blog will help you understand how fear, greed, and impatience impact trading and how to conquer them for good. 🔍 1. Understanding Fear in Trading Fear often shows up when:n You’re unsure of your strategy. You’ve had a recent loss. You’re risking too much capital. Fear can lead to hesitation, missed opportunities, or exiting trades too early. To handle fear: Backtest your strategy and build confidence in it. Use smaller position sizes. Stick to your stop-loss. 💰 2. Tackling Greed: The Silent Capital Killer Greed makes traders: Ignore exit points hoping for more profit. Overtrade during a winning streak. Double down on risky positions. To keep greed in check: Set realistic profit targets. Journal your trades to analyze behavior. Remind yourself: “Profit is profit — no one went broke booking gains.” ⏳ 3. Impatience: The Urge to Trade Every Candle Impatience makes you: Enter trades too early without confirmation. Chase after every movement. Get frustrated waiting for setups. How to stay patient: Use alerts to notify you of valid setups. Avoid watching the screen all day. Practice mindfulness or deep breathing to reduce anxiety. 🎯 4. Develop a Strong Trading Mindset Have a Plan: Entry, exit, stop-loss, risk-reward — write it all down. Risk Management: Never risk more than 1–2% per trade. Follow a Routine: Journal daily. Reflect weekly. Accept Losses: Even the best traders lose sometimes. Take Breaks: A calm mind is sharper than a stressed one. 🧠 Trade with Bhagyashri: Learn the Mental Edge At Trade with Bhagyashri, we don’t just teach charts — we teach mindset mastery. Our online & offline courses cover: Trading psychology basics Real-world examples from Indian markets Guided emotional control techniques 📢 Final Thought The biggest enemy in trading isn’t the market — it’s your mind. Train your emotions like you train your strategy, and you’ll be ahead of most traders.
How to Control Emotions While Trading

Blog Details Trading is not just about charts, strategies, or technical analysis — it’s also about mastering your mindset. Emotional trading leads to impulsive decisions, poor risk management, and ultimately, losses. If you want to be a successful trader, learning how to control emotions is crucial. Why Emotions Matter in Trading Every decision you make in the market is either supported or sabotaged by your emotions. Fear, greed, impatience, overconfidence — all of these can lead to: Exiting too early Holding onto losing trades Overtrading Ignoring stop-losses Common Emotional Triggers Fear of Missing Out (FOMO) Jumping into trades because everyone else is Greed Holding on too long hoping for more profit Revenge Trading Trying to recover losses with random trades Overconfidence After a winning streak, risking more than usual 7 Powerful Ways to Control Emotions in Trading 1. Follow a Trading Plan Have a clearly defined plan with entry, exit, and stop-loss levels. Stick to it, no matter how tempting it is to deviate. 2. Accept Losses as Part of the Game No one wins every trade. Accepting small losses is part of trading wisely. 3. Use Proper Risk Management Never risk more than 1–2% of your capital per trade. Knowing your maximum loss helps reduce emotional pressure. 4. Keep a Trading Journal Record every trade, along with the reason you took it and how you felt. Review it weekly to track patterns and emotional triggers. 5. Take Breaks If you feel frustrated or overexcited, step away. Clear your mind before making the next move. 6. Avoid Trading to Recover Losses Revenge trading is one of the fastest ways to blow your capital. Let the market reset, and come back with a fresh mindset. 7. Practice Meditation or Mindfulness Just 5-10 minutes a day can help calm your nervous system, improve focus, and reduce reactive behavior. Learn Trading Psychology with Trade with Bhagyashri At Trade with Bhagyashri, we focus not just on strategies but also on trader mindset. Our offline and online courses include: Live trading psychology sessions Practical emotional control techniques Real examples from Indian markets
Stock Market for Beginners: How to Start Trading in India the Right Way

Blog Details Entering the stock market for the first time can feel overwhelming — too many terms, too many platforms, and too much risk. But with the right guidance, trading in India can become a smart, strategic way to build wealth. In this beginner’s guide, we’ll break down how to start trading in the Indian stock market the right way. What Is the Stock Market? The stock market is a platform where companies list their shares for the public to invest in. These shares are traded through stock exchanges like the NSE (National Stock Exchange) and BSE (Bombay Stock Exchange). Investors and traders buy and sell shares to profit from price movements or earn dividends. Step-by-Step Guide to Start Trading in India 1. Understand the Basics Before you risk any money, learn basic concepts like: What are shares, IPOs, and indices (like Nifty 50, Sensex)? The difference between trading and investing What are bull markets vs bear markets? 2. Open a Trading + Demat Account To buy or sell shares in India, you need: A Demat Account to store your shares digitally A Trading Account to place orders Popular brokers include: Zerodha Upstox Groww Angel One 3. Link Your Bank Account Ensure your savings bank account is linked with your trading account for easy fund transfers. 4. Learn Technical and Fundamental Analysis Fundamental analysis: Understanding company performance, financials, and news Technical analysis: Reading charts, candlestick patterns, indicators like RSI and MACD 5. Start with Small Capital Don’t jump in with all your savings. Start small and learn: How the market reacts to news How to set stop-loss and target The importance of patience and discipline 6. Choose Your Trading Style Intraday: Buy and sell within a day Swing Trading: Hold for days or weeks Positional Trading: Hold for weeks or months Investing: Long-term wealth creation 7. Use Tools and Platforms Use apps like: TradingView for charting and analysis Moneycontrol or TickerTape for stock info Chartink for scanning patterns 8. Practice with Paper Trading Before going live, try virtual trading to test your strategy. Mistakes to Avoid as a Beginner Overtrading due to excitement Blindly following tips or Telegram groups Ignoring risk management Trading without learning or mentorship Join a Trading Course for Faster Growth If you’re serious about learning trading step-by-step, join a structured course. At Trade with Bhagyashri, we help beginners: Learn candlestick patterns and chart reading Understand market psychology Practice in live market conditions Build consistent strategies 📘 Bonus Tip: Start reading simple eBooks on trading concepts. You can download beginner-friendly books directly from our website. 🧠 Still confused? Read our next blog: “Mastering Candlestick Patterns: A Visual Guide” for more insight.
Mastering Candlestick Patterns: A Visual Guide for Beginners
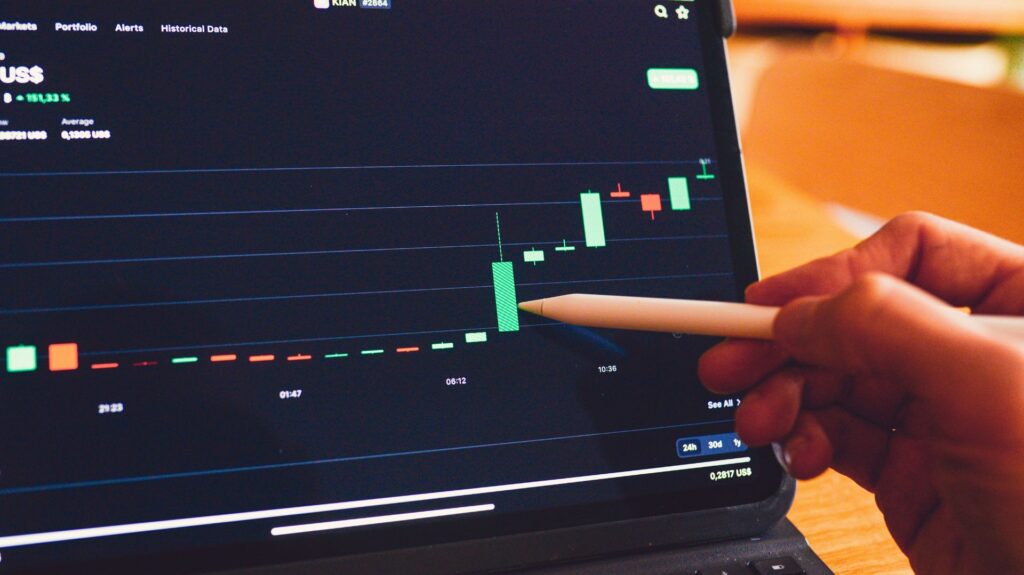
Blog Details If you’re serious about improving your trading skills, understanding candlestick patterns is an essential first step. Candlesticks are more than just colorful bars on a chart — they represent price action, market psychology, and trader behavior. In this beginner-friendly guide, you’ll learn how to read candlestick patterns, recognize the most important formations, and apply them to real trades. What Are Candlestick Patterns? Candlestick patterns are visual representations of price movement over a specific period. Each candle reflects four key pieces of information: open, high, low, and close. When you learn to interpret these patterns, you can make smarter trading decisions based on momentum, trend strength, and potential reversals. Why Learn Candlestick Patterns? They help you identify market trends and reversals early They improve entry and exit timing They’re universally used by traders, from beginners to professionals They can be combined with indicators for more accurate setups Bullish vs Bearish Patterns Candlestick patterns fall into two major categories: Bullish Patterns: Suggest the price may rise. Typically found at the bottom of a downtrend. Bearish Patterns: Indicate potential price drops. Usually seen at the top of an uptrend. 5 Must-Know Candlestick Patterns 1. Hammer (Bullish Reversal) Appears after a downtrend Small body, long lower wick Indicates buyers are gaining strength 2. Engulfing Pattern Bullish: Green candle fully covers the previous red candle Bearish: Red candle completely engulfs the previous green candle Reliable on higher time frames like 1-hour or daily 3. Doji Tiny or no body with long wicks Shows indecision in the market Use confirmation candle to trade 4. Morning Star (Bullish Reversal) Three-candle pattern: Red candle Small-bodied candle (Doji or Spinning Top) Strong green candle Seen near support zones 5. Shooting Star (Bearish Reversal) Appears after an uptrend Small body with long upper wick Signals weakness in buying pressure Tools to Practice Candlestick Reading TradingView: Free charting tool with replay feature Chartink: Pattern scanner for Indian stocks Notion/Excel: For maintaining a candle journal with screenshots Common Mistakes to Avoid Trading every pattern without confirmation Ignoring volume or market context Forgetting to use stop-losses Overtrading based on just one signal Final Tips Always combine candlestick patterns with trend lines, support/resistance, and indicators like RSI or VWAP Backtest strategies before using them in live trades Practice daily and maintain a trade journal
