If you’re serious about improving your trading skills, understanding candlestick patterns is an essential first step. Candlesticks are more than just colorful bars on a chart — they represent price action, market psychology, and trader behavior. In this beginner-friendly guide, you’ll learn how to read candlestick patterns, recognize the most important formations, and apply them to real trades.
What Are Candlestick Patterns?
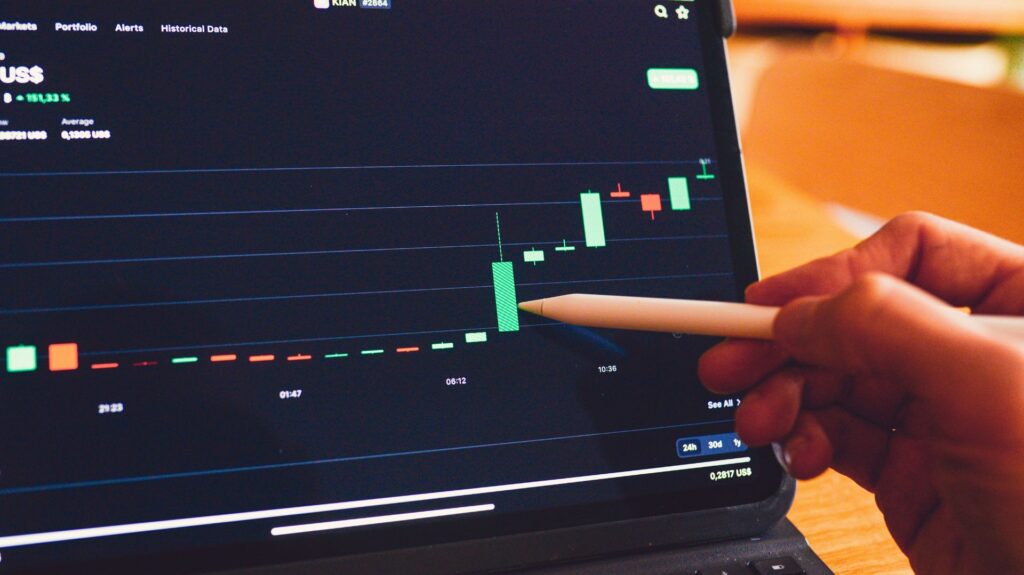
Candlestick patterns are visual representations of price movement over a specific period. Each candle reflects four key pieces of information: open, high, low, and close. When you learn to interpret these patterns, you can make smarter trading decisions based on momentum, trend strength, and potential reversals.
Why Learn Candlestick Patterns?
They help you identify market trends and reversals early
They improve entry and exit timing
They’re universally used by traders, from beginners to professionals
They can be combined with indicators for more accurate setups
Bullish vs Bearish Patterns
Candlestick patterns fall into two major categories:
Bullish Patterns: Suggest the price may rise. Typically found at the bottom of a downtrend.
Bearish Patterns: Indicate potential price drops. Usually seen at the top of an uptrend.
5 Must-Know Candlestick Patterns
1. Hammer (Bullish Reversal)
Appears after a downtrend
Small body, long lower wick
Indicates buyers are gaining strength
2. Engulfing Pattern
Bullish: Green candle fully covers the previous red candle
Bearish: Red candle completely engulfs the previous green candle
Reliable on higher time frames like 1-hour or daily
3. Doji
Tiny or no body with long wicks
Shows indecision in the market
Use confirmation candle to trade
4. Morning Star (Bullish Reversal)
Three-candle pattern:
Red candle
Small-bodied candle (Doji or Spinning Top)
Strong green candle
Seen near support zones
5. Shooting Star (Bearish Reversal)
Appears after an uptrend
Small body with long upper wick
Signals weakness in buying pressure
Tools to Practice Candlestick Reading
TradingView: Free charting tool with replay feature
Chartink: Pattern scanner for Indian stocks
Notion/Excel: For maintaining a candle journal with screenshots
Common Mistakes to Avoid
Trading every pattern without confirmation
Ignoring volume or market context
Forgetting to use stop-losses
Overtrading based on just one signal
Final Tips
Always combine candlestick patterns with trend lines, support/resistance, and indicators like RSI or VWAP
Backtest strategies before using them in live trades
Practice daily and maintain a trade journal
Welcome to Trade4u, the official learning platform of Trade with Bhagyashri – where your trading journey begins with knowledge, confidence, and real market wisdom.